
American Crossroads is countering the Democratic National Convention with an ad claiming that President Obama has taken the country “backward,” citing what the ad calls “America’s worst economic recovery ever.” However, the ad ignores the severity of the recession President Bush left behind, as well as the decline in government employment (which conservatives favor) that distinguishes the current recovery from previous ones. Indeed, the private sector has grown steadily for the past 30 months, adding 4.6 million jobs during that period. Crossroads also dishonestly calls the Affordable Care Act a “tax on middle-class families” and blames the president for deficits that are fueled by Bush policies and the recession.
Massive Monthly Job Losses Obama Inherited Have Turned Into Steady Private-Sector Growth
This ad check has been updated to included the latest monthly jobs report.
Recession Officially Ran From December 2007 To June 2009, Making It The Longest Since World War II. From the National Bureau of Economic Research: “The Business Cycle Dating Committee of the National Bureau of Economic Research met yesterday by conference call. At its meeting, the committee determined that a trough in business activity occurred in the U.S. economy in June 2009. The trough marks the end of the recession that began in December 2007 and the beginning of an expansion. The recession lasted 18 months, which makes it the longest of any recession since World War II. Previously the longest postwar recessions were those of 1973-75 and 1981-82, both of which lasted 16 months. In determining that a trough occurred in June 2009, the committee did not conclude that economic conditions since that month have been favorable or that the economy has returned to operating at normal capacity. Rather, the committee determined only that the recession ended and a recovery began in that month.” [NBER.org, 9/20/10]
- Recession Resulted In 8.3 Million Job Losses. According to the Associated Press, “the Great Recession killed 8.3 million jobs, compared with 1.6 million lost in the 2001 recession.” [Associated Press via Yahoo! News, 5/4/12]
Bush Recession Was So Severe That Economy Was Still Shedding Over Three-Quarters Of A Million Jobs Per Month Through First Few Months Of President Obama’s Term. According to the Bureau of Labor Statistics, the economy shed 839,000 jobs in January 2009, 725,000 in February 2009, 787,000 in March 2009, and 802,000 in April 2009, for a four-month average of 788,250 lost jobs per month. [BLS.gov, accessed 5/3/12]
Since The Recession Ended In June 2009, The Private Sector Has Added Over 3.4 Million Jobs While Public-Sector Employment Has Fallen By 670,000. According to the Bureau of Labor Statistics, there were 107,933,000 private-sector jobs in June 2009, and 111,400,000 private-sector jobs in August 2012, an increase of 3,467,000 jobs. The BLS also reports that there were 22,570,000 Americans working in the public sector in June 2009, and 21,900,000 working in the public sector in August 2012, a decrease of 670,000 jobs. The private-sector gains and public-sector losses add up to a total increase of 2,797,000 jobs.
The following chart shows the cumulative private-sector job gains and public-sector job losses since the recession officially ended in June 2009:
[BLS.gov, accessed 9/7/12; BLS.gov, accessed 9/7/12; NBER.org, 9/20/10]

The Private Sector Has Added 4.6 Million Jobs Over 30 Consecutive Months Of Private-Sector Growth. The following chart shows the monthly change in private-sector jobs dating back to January 2008.

President Obama’s Recovery Dragged Down By Government Layoffs, While Past Recoveries Were Bolstered By Public-Sector Growth
Previous Recoveries Were Bolstered By Public-Sector Growth. The following chart, based on BLS data, shows the cumulative change in public-sector employment in the first two years of the Obama recovery and the three most recent previous recoveries:
[BLS.gov, accessed 4/10/12]

- Conservative AEI: The Public Sector Is Shrinking, But Private-Sector Growth Is Above Average. From American Enterprise Institute scholar Mark J. Perry: “In the second quarter of 2012, ‘public sector GDP’ decreased -1.44%, and that was the eighth straight quarter of negative growth for total government spending, averaging -2.88% per quarter over the last two years. In contrast, there have been 12 consecutive quarters of positive growth for private sector GDP averaging 3.07% per quarter in the three years since the recession ended, which is slightly higher than the 2.8% average growth rate in private real GDP over the last 25 years.” [AEI-Ideas.org, 7/31/12]
- GOP-Favored “Government Downsizing” Has Been “A Drag” On Job Growth. From the Associated Press: “Conservative Republicans have long clamored for government downsizing. They’re starting to get it — by default. Crippled by plunging tax revenues, state and local governments have shed over a half million jobs since the recession began in December 2007. And, after adding jobs early in the downturn, the federal government is now cutting them as well. States cut 49,000 jobs over the past year and localities 210,000, according to an analysis of Labor Department statistics. There are 30,000 fewer federal workers now than a year ago — including 5,300 Postal Service jobs canceled last month. By contrast, private-sector jobs have increased by 1.6 million over the past 12 months. But the state, local and federal job losses have become a drag on efforts to nudge the nation’s unemployment rate down from its painfully high 9.1 percent.” [Associated Press, 10/25/11]
Affordable Care Act Does Not Raise Taxes On Most Americans – And Includes Tax Credits For Millions
Affordable Care Act “Will Provide More Tax Relief Than Tax Burden” For Middle Class. According to the Washington Post fact checker Glenn Kessler: “The health law, if it works as the nonpartisan government analysts expect, will provide more tax relief than tax burden for middle-income Americans.” [WashingtonPost.com, 7/6/12]
FactCheck.org: “A Large Majority Of Americans Would Not See Any Direct Tax Increase From The Health Care Law.” According to FactCheck.org: “It’s certainly true that the health care law would raise taxes on some Americans, particularly those with higher incomes. The law includes a Medicare payroll tax of 0.9 percent on income over $200,000 for individuals or $250,000 for couples, and a 3.8 percent tax on investment income for those earning that much. The Joint Committee on Taxation estimated that the biggest chunk of revenue — $210.2 billion — comes from those taxes. There are other taxes in the health care law — including an excise tax on the manufacturers of certain medical devices and on indoor tanning services. The health care law included $437.8 billion in tax revenue over 10 years, according to the Joint Committee on Taxation‘s calculations. Republicans tend to add in fees on individuals who don’t obtain health insurance (which the Supreme Court now agrees can be considered taxes) and businesses that don’t provide it to bump that up to about $500 billion. Some taxes, such as those on medical devices, may or may not be passed on to consumers in the form of higher prices, but a large majority of Americans would not see any direct tax increase from the health care law.” [FactCheck.org, 6/28/12]
- Individual Penalty Payments “Tiny” Compared To President Obama’s Previous Tax Cuts. According to FactCheck.org, the increased revenue from penalty payments by individuals who do not obtain health insurance represents “a tiny future increase compared with the tax cuts Obama has already delivered, including an estimated $120 billion in 2012 alone from the 2 percentage point cut in payroll taxes.” [FactCheck.org, 5/17/12]
Affordable Care Act Includes Tax Credits For Millions Of Americans. According to Families USA: “We found that an estimated 28.6 million Americans will be eligible for the tax credits in 2014, and that the total value of the tax credits that year will be $110.1 billion. The new tax credits will provide much-needed assistance to insured individuals and families who struggle harder each year to pay rising premiums, as well as to uninsured individuals and families who need help purchasing coverage that otherwise would be completely out of reach financially. Most of the families who will be eligible for the tax credits will be employed, many for small businesses, and will have incomes between two and four times poverty (between $44,100 and $88,200 for a family of four based on 2010 poverty guidelines).” [FamiliesUSA.org, September 2010]
Bush Policies And Recession Caused Debt To Skyrocket
Prior To President Obama’s Inauguration, President Bush Had Already Created A Projected $1.2 Trillion Deficit For Fiscal Year 2009. From the Washington Times: “The Congressional Budget Office announced a projected fiscal 2009 deficit of $1.2 trillion even if Congress doesn’t enact any new programs. […] About the only person who was silent on the deficit projection was Mr. Bush, who took office facing a surplus but who saw spending balloon and the country notch the highest deficits on record.” [Washington Times, 1/8/09]
NYT: President Bush’s Policy Changes Created Much More Debt Than President Obama’s. The New York Times published the following chart comparing the fiscal impact of policies enacted under the Bush and Obama administrations:
[New York Times, 7/24/11]

Recession Added Hundreds Of Billions In Deficits By Increasing Spending On Safety Net While Shrinking Tax Revenue. The Center on Budget and Policy Priorities (CBPP) explains: “When unemployment rises and incomes stagnate in a recession, the federal budget responds automatically: tax collections shrink, and spending goes up for programs like unemployment insurance, Social Security, and Food Stamps.” According to CBPP: “The recession battered the budget, driving down tax revenues and swelling outlays for unemployment insurance, food stamps, and other safety-net programs. Using CBO’s August 2008 projections as a benchmark, we calculate that the changed economic outlook alone accounts for over $400 billion of the deficit each year in 2009 through 2011 and slightly smaller amounts in subsequent years. Those effects persist; even in 2018, the deterioration in the economy since the summer of 2008 will account for over $300 billion in added deficits, much of it in the form of additional debt-service costs.” [CBPP.org, 11/18/10; CBPP.org, 5/10/11, citations removed]
Over The Coming Decade, The Bush Tax Cuts Are The Primary Cause Of Federal Budget Deficits. The Center on Budget and Policy Priorities prepared a chart showing the deficit impact of the Bush tax cuts (orange), the Iraq and Afghanistan wars, the recession itself, and spending to rescue the economy:
[CBPP.org, 5/10/11]

CBPP: Bush Tax Cuts And Wars Are Driving The Debt. According to the Center on Budget and Policy Priorities:
The complementary chart, below, shows that the Bush-era tax cuts and the Iraq and Afghanistan wars — including their associated interest costs — account for almost half of the projected public debt in 2019 (measured as a share of the economy) if we continue current policies.
[Center on Budget and Policy Priorities, 5/20/11]

Republicans Have Opposed President Obama’s Deficit-Reduction Efforts
Under President Obama’s FY 2013 Budget, Deficit Would Fall Below $1 Trillion For First Time Since Bush Left Office. According to the Congressional Budget Office’s analysis of President Obama’s FY 2013 budget proposal, “the deficit would decline to $977 billion (or 6.1 percent of GDP)” in 2013, and further fall to 3 percent of GDP in 2022. By contrast, according to the Center on Budget and Policy Priorities: “The deficit for fiscal year 2009 — which began more than three months before President Obama’s inauguration — was $1.4 trillion and, at 10 percent of Gross Domestic Product (GDP), the largest deficit relative to the economy since the end of World War II.” [CBO.gov, March 2012; CBPP.org, 5/10/11]
September 2011: Obama Proposed $3 Trillion In Deficit Reduction; “Republicans Swiftly Responded … With Opposition.” According to the Los Angeles Times: “President Obama on Monday made an aggressive pitch for his $3-trillion deficit-reduction strategy, promising to veto any proposal that fails to raise revenues by asking wealthy Americans to ‘pay their fair share.’ […] His plan for lopping $3 trillion from the deficit is on top of the approximately $1 trillion in spending cuts that he signed into law in August, after reaching a deal with Republican congressional leaders to lift the nation’s debt ceiling. On Monday, Republicans swiftly responded to the president’s proposal with opposition. [Los Angeles Times, 9/19/11]
April 2011: GOP Rejected Obama Proposal To Reduce Deficits By $4 Trillion. According to the Boston Globe: “President Obama pledged yesterday to pare the projected deficit by $4 trillion in the next 12 years, vowing to protect the nation’s most vulnerable while pushing again for higher taxes for its richest citizens. […] His call for the end of the Bush tax cuts for incomes above $250,000 for couples reignites a ferocious debate from the fall midterm elections. That element of the speech triggered the most vociferous and immediate opposition from Republicans.” [Boston Globe, 4/14/11]
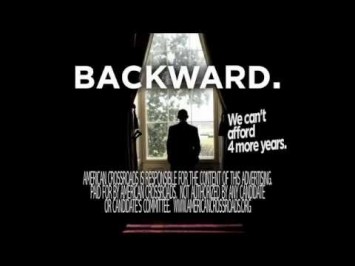
[NARRATOR:] President Obama says he’ll move us forward. But where’s he taken us so far? America’s worst economic recovery ever. Twenty-three million of us without full-time work. Family incomes down. Forty percent living paycheck to paycheck. And Obamacare’s new tax on middle-class families. All while Obama racked up $5 trillion more in debt. Is that really forward – or backward? American Crossroads is responsible for the content of this advertising. [American Crossroads via YouTube.com, 9/3/12]