
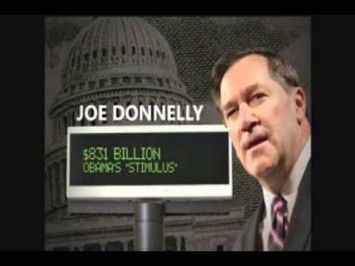
Ending Spending claims that Rep. Joe Donnelly (D-IN) is “spending our future away,” connecting his support for the health care law and the Recovery Act to the rising debt. However, the Affordable Care Act actually reduces the deficit, while the stimulus bill created jobs and helped rescue the economy from a deeper recession. In reality, Bush administration policies and the recession itself caused deficits to explode in recent years.
Affordable Care Act Reduces The Deficit
CBO: The Affordable Care Act Will Reduce Deficits By Over $200 Billion From 2012-2021. According to Congressional Budget Office Director Douglas Elmendorf’s testimony before the House on March 30, 2011: “CBO and JCT’s most recent comprehensive estimate of the budgetary impact of PPACA and the Reconciliation Act was in relation to an estimate prepared for H.R. 2, the Repealing the Job-Killing Health Care Law Act, as passed by the House of Representatives on January 19, 2011. H.R. 2 would repeal the health care provisions of those laws. CBO and JCT estimated that repealing PPACA and the health-related provisions of the Reconciliation Act would produce a net increase in federal deficits of $210 billion over the 2012–2021 period as a result of changes in direct spending and revenues. Reversing the sign of the estimate released in February provides an approximate estimate of the impact over that period of enacting those provisions. Therefore, CBO and JCT effectively estimated in February that PPACA and the health-related provisions of the Reconciliation Act will produce a net decrease in federal deficits of $210 billion over the 2012–2021 period as a result of changes in direct spending and revenues.” [“CBO’s Analysis of the Major Health Care Legislation Enacted in March 2010,” CBO.gov, 3/30/11]
“2 Trillion” Refers To Gross Cost Of Insurance Provisions – Not ACA’s Impact On The Deficit
July 2012: CBO’s Updated Estimate For Gross Cost Of ACA Insurance Coverage Provisions Is $1.683 Trillion. According to a Congressional Budget Office Report titled “Estimates for the Insurance Coverage Provisions of the Affordable Care Act Updated for the Recent Supreme Court Decision”: “CBO and JCT now estimate that the insurance coverage provisions of the ACA will have a net cost of $1,168 billion over the 2012–2022 period—compared with $1,252 billion projected in March 2012 for that 11-year period. That net cost reflects the following: Gross costs of $1,683 billion for Medicaid, CHIP, tax credits, and other subsidies for the purchase of health insurance through the newly established exchanges (and related costs), and tax credits for small employers. […] Those gross costs are offset in part by $515 billion in receipts from penalty payments, the new excise tax on high-premium insurance plans, and other budgetary effects (mostly increases in tax revenues stemming from changes in employer-provided insurance coverage).” [CBO.gov, July 2012, internal citations removed]
- July 2012 Report Affirmed Projection That ACA Will Reduce Deficits. According to a Congressional Budget Office Report titled “Estimates for the Insurance Coverage Provisions of the Affordable Care Act Updated for the Recent Supreme Court Decision”: “CBO and JCT have not updated their estimate of the overall budgetary impact of the ACA; previously, they estimated that the law would, on net, reduce budget deficits.” [CBO.gov, July 2012]
“Wasteful” Recovery Act Created Millions Of Jobs, Boosted GDP, And Cut Taxes
Recovery Act “Succeeded In…Protecting The Economy During The Worst Of The Recession.” From the Center on Budget and Policy Priorities: “A new Congressional Budget Office (CBO) report estimates that the American Recovery and Reinvestment Act (ARRA) increased the number of people employed by between 200,000 and 1.5 million jobs in March. In other words, between 200,000 and 1.5 million people employed in March owed their jobs to the Recovery Act. […] ARRA succeeded in its primary goal of protecting the economy during the worst of the recession. The CBO report finds that ARRA’s impact on jobs peaked in the third quarter of 2010, when up to 3.6 million people owed their jobs to the Recovery Act. Since then, the Act’s job impact has gradually declined as the economy recovers and certain provisions expire.” [CBPP.org, 5/29/12]
At Its Peak, Recovery Act Was Responsible For Up To 3.6 Million Jobs. According to the nonpartisan Congressional Budget Office:
CBO estimates that ARRAs [sic] policies had the following effects in the third quarter of calendar year 2010:
- They raised real (inflation-adjusted) gross domestic product by between 1.4 percent and 4.1 percent,
- Lowered the unemployment rate by between 0.8 percentage points and 2.0 percentage points,
- Increased the number of people employed by between 1.4 million and 3.6 million, and
- Increased the number of full-time-equivalent (FTE) jobs by 2.0 million to 5.2 million compared with what would have occurred otherwise. (Increases in FTE jobs include shifts from part-time to full-time work or overtime and are thus generally larger than increases in the number of employed workers). [CBO.gov, 11/24/10]
Recovery Act Included $288 Billion In Tax Cuts. From PolitiFact: “Nearly a third of the cost of the stimulus, $288 billion, comes via tax breaks to individuals and businesses. The tax cuts include a refundable credit of up to $400 per individual and $800 for married couples; a temporary increase of the earned income tax credit for disadvantaged families; and an extension of a program that allows businesses to recover the costs of capital expenditures faster than usual. The tax cuts aren’t so much spending as money the government won’t get — so it can stay in the economy.” [PolitiFact.com, 2/17/10]
Bush Policies And Recession Caused Debt To Skyrocket
Prior To President Obama’s Inauguration, President Bush Had Already Created A Projected $1.2 Trillion Deficit For Fiscal Year 2009. From the Washington Times: “The Congressional Budget Office announced a projected fiscal 2009 deficit of $1.2 trillion even if Congress doesn’t enact any new programs. […] About the only person who was silent on the deficit projection was Mr. Bush, who took office facing a surplus but who saw spending balloon and the country notch the highest deficits on record.” [Washington Times, 1/8/09]
NYT: President Bush’s Policy Changes Created Much More Debt Than President Obama’s. The New York Times published the following chart comparing the fiscal impact of policies enacted under the Bush and Obama administrations:
[New York Times, 7/24/11]

Recession Added Hundreds Of Billions In Deficits By Increasing Spending On Safety Net While Shrinking Tax Revenue. The Center on Budget and Policy Priorities (CBPP) explains: “When unemployment rises and incomes stagnate in a recession, the federal budget responds automatically: tax collections shrink, and spending goes up for programs like unemployment insurance, Social Security, and Food Stamps.” According to CBPP: “The recession battered the budget, driving down tax revenues and swelling outlays for unemployment insurance, food stamps, and other safety-net programs. Using CBO’s August 2008 projections as a benchmark, we calculate that the changed economic outlook alone accounts for over $400 billion of the deficit each year in 2009 through 2011 and slightly smaller amounts in subsequent years. Those effects persist; even in 2018, the deterioration in the economy since the summer of 2008 will account for over $300 billion in added deficits, much of it in the form of additional debt-service costs.” [CBPP.org, 11/18/10; CBPP.org, 5/10/11, citations removed]
Over The Coming Decade, The Bush Tax Cuts Are The Primary Cause Of Federal Budget Deficits. The Center on Budget and Policy Priorities prepared a chart showing the deficit impact of the Bush tax cuts (orange), the Iraq and Afghanistan wars, the recession itself, and spending to rescue the economy:
[CBPP.org, 5/10/11]

CBPP: Bush Tax Cuts And Wars Are Driving The Debt. According to the Center on Budget and Policy Priorities:
The complementary chart, below, shows that the Bush-era tax cuts and the Iraq and Afghanistan wars — including their associated interest costs — account for almost half of the projected public debt in 2019 (measured as a share of the economy) if we continue current policies.
[Center on Budget and Policy Priorities, 5/20/11]

[NARRATOR:] … In Washington, politicians like Joe Donnelly are spending our future away. Donnelly voted for Obama’s $2 trillion health care law and wasteful stimulus. Now we’re $16 trillion in debt and borrowing $4 billion a day. Our country’s in trouble. We need leaders like Richard Mourdock who will fight Washington’s irresponsible spending. Indiana can’t afford Joe Donnelly. Ending spending is responsible for the content of this advertising. [Ending Spending, 11/2/12]